Scalable and Performant ASP.NET Core Web APIs: Profiling and Monitoring

This is the 2nd post in a series of articles on creating performant and scalable web APIs using ASP.NET Core 2.0. In this post we’ll focus on tools that can help us profile and monitor our API so that we can spot any performance and scalability issues before our customers do.
Often, like most bugs, the earlier in the development cycle we find a performance or scalability problem, the quicker and easier it is to fix. So, it is important to make use of these tools from the start of the development cycle as well as when the API is in production.
During our dev cycles, as well as checking we get the right status code, response body, … we should check the duration of the call and the size of the response. We’ll then hopefully spot if the API is slowing down during the development phase.
Below is the popular Postman tool, giving us the duration and size of the response.

Development Profiling Tools
Apart from keeping an eye on the duration and size of the API calls, what else can we do? What other tools are there in the development phase to give us confidence that the API is going to perform and scale well?
Stackify Prefix
Stackify Prefix is a great free profiling tool that can be used during the development of an ASP.NET Core Web API. It tracks web requests and database queries and we can even wire it up to Serilog. It’s really useful to have this on a 2nd screen as we build out our API.
To get started with Prefix and profile our API, first download Prefix and then bring in the following nuget package:
StackifyMiddleware;We then need to add the Stackify middleware before the MVC middleware. It also needs to come before any exception logging middleware as well so that the exceptions appear in Prefix:
public class Startup{    ...
    public void Configure(IApplicationBuilder app, IHostingEnvironment env)    {        ...        // The Stackify middleware needs to come before any exception handling middleware and the MVC middleware        app.UseMiddleware<StackifyMiddleware.RequestTracerMiddleware>();        app.UseMiddleware<SerilogRequestLogger>();        app.UseMvc();    }}
If we want to include the Serilog logs in Prefix, we need to bring in the following nuget package:
Serilog.Sinks.Stackify… and add the following bits in appSettings.json:
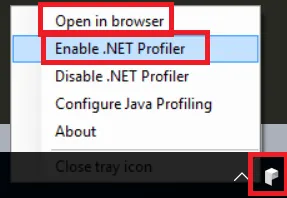
{ "Serilog": { ... "WriteTo": [ { "Name": "Stackify", "Args": { "restrictedToMinimumLevel": "Debug" } }, ... ] }}To run prefix, we need to click on the icon in the task bar, enable it and then open it in a browser:
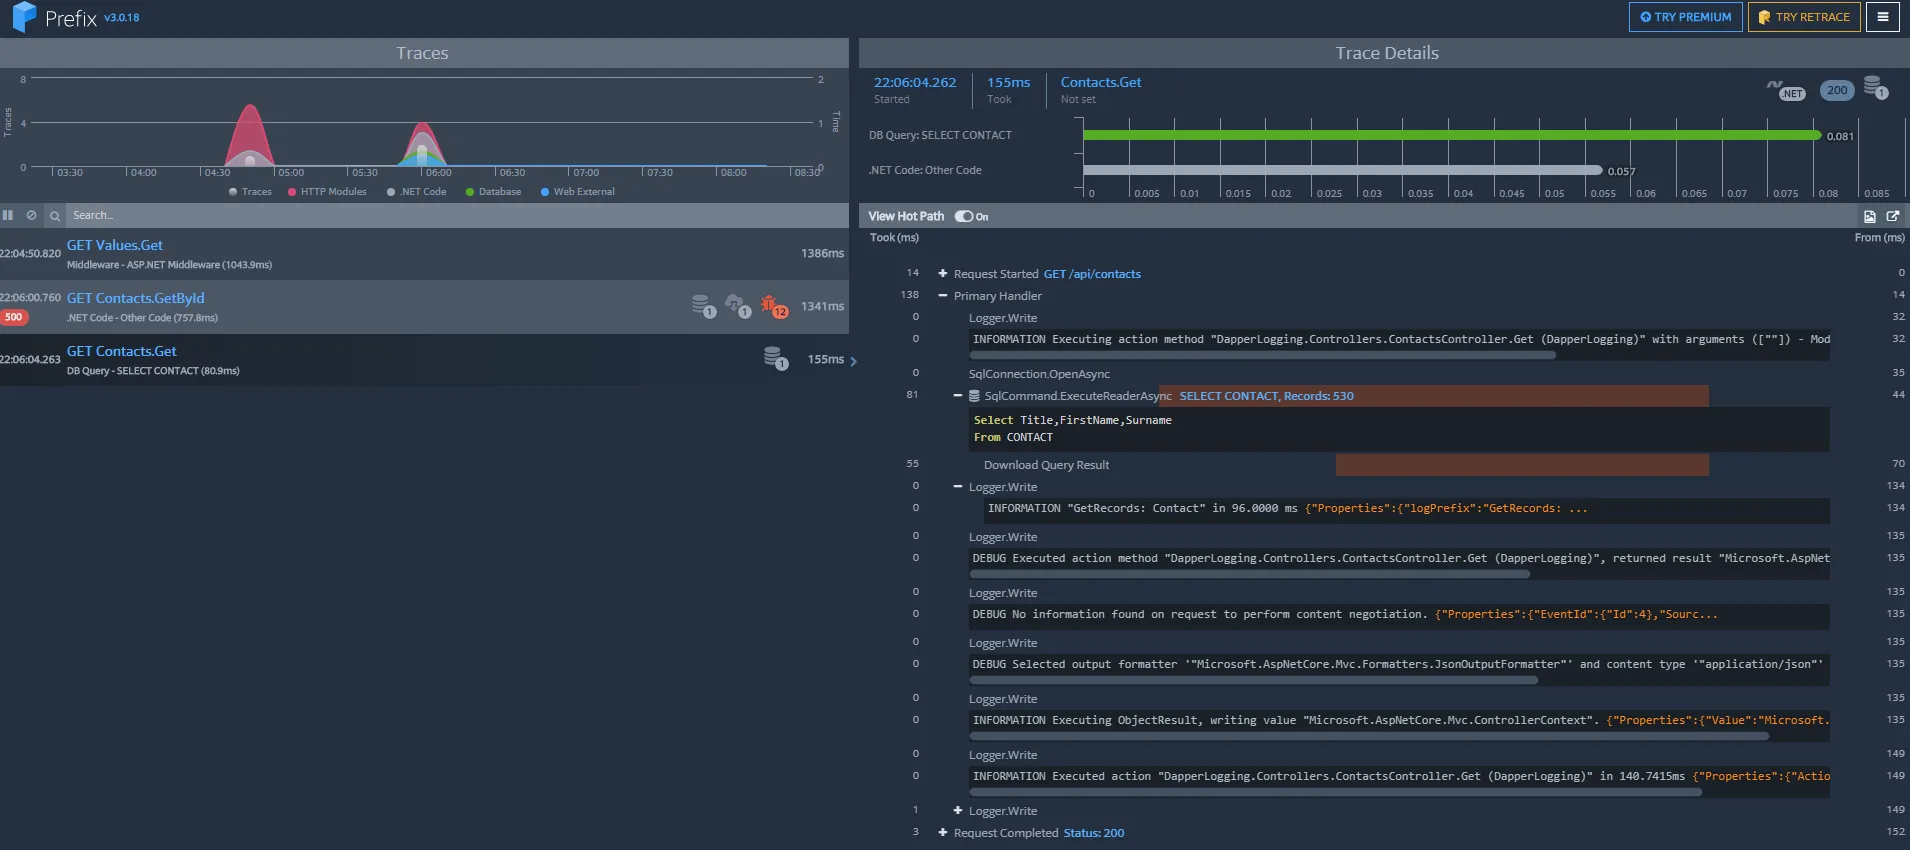
If we then run our ASP.NET Core Web API in Visual Studio, Prefix will start to profile our API. We will see the requests, database queries and other information we’ve written to Serilog:
Nice!
Application Insights in Visual Studio
Application Insights is Mircosoft’s fully fledged Application Performance Monitoring (APM) tool (we’ll come on to APMs later in this post). We can run this locally in Visual Studio 2017 to profile the API during development as an alternative to Stackify Prefix. It’s convenient because we are already likely using Visual Studio to develop the API.
To add this to a Visual Studio project, we right click on project in Solution Explorer and click “Add > Application Insights Telementry …”. We then click the “Start Free” button and then click “Or just add the SDK to try local only mode” at the bottom of the screen. The Application Insights SDK will then be added to the solution.
Application Insights, will automatically track our web requests - we don’t need to add any middleware. Unlike, Prefix, it doesn’t track database queries - we’d need to track these in our logger and wire Application Insights up to our logger (it is automatically wired up to the standard ILogger).
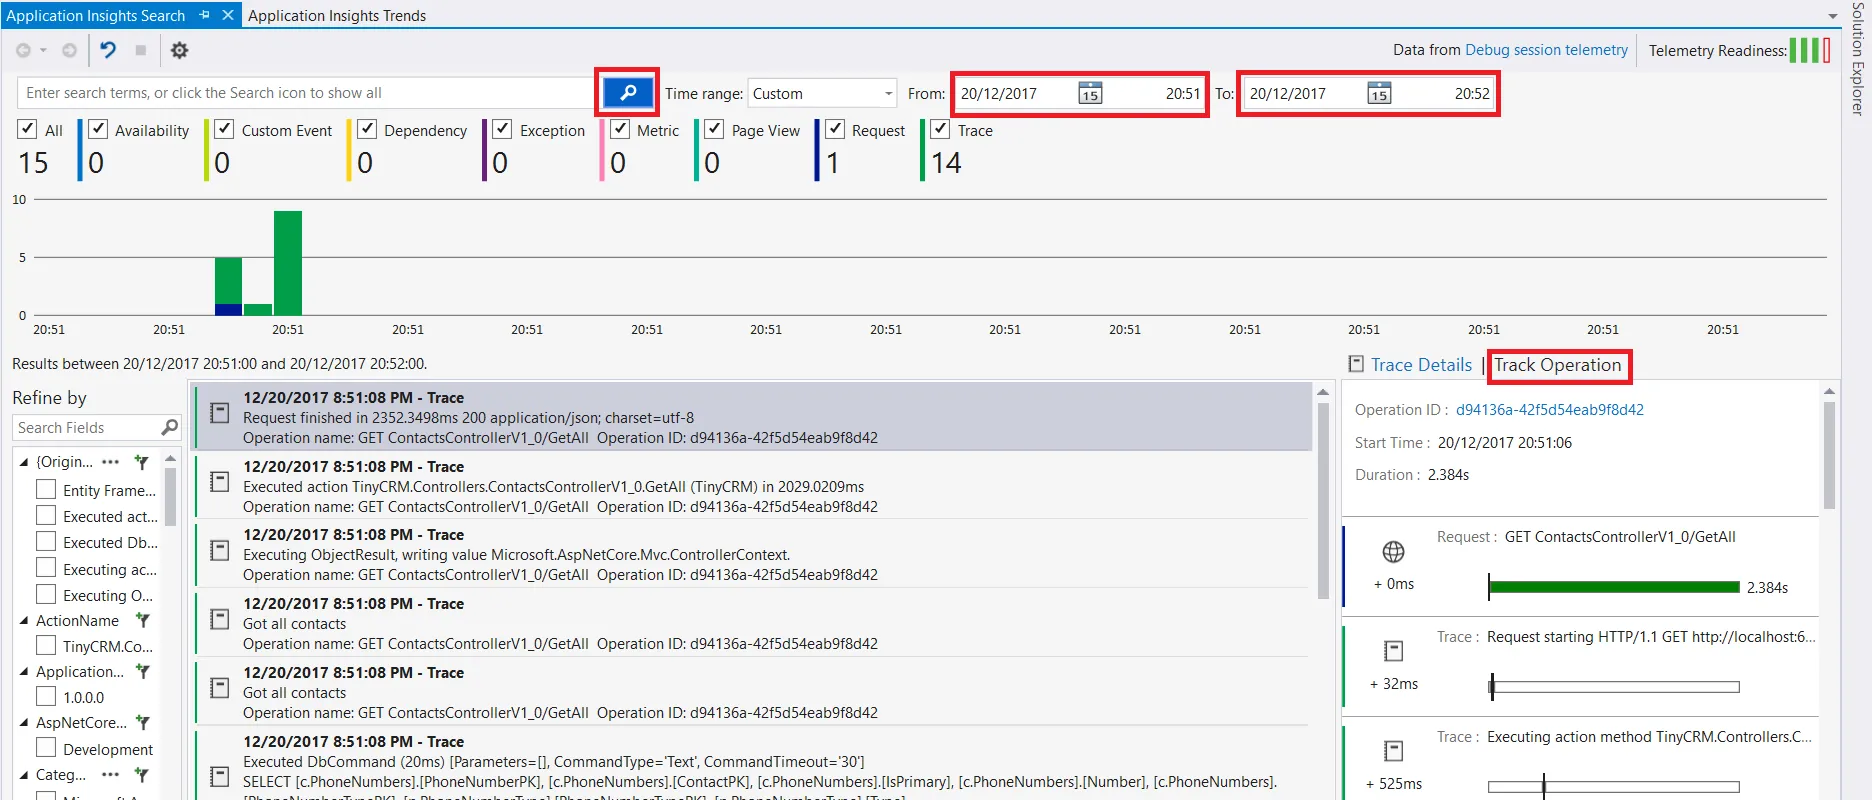
After we’ve added Application Insights to our solution in Visual Studio, we can view the trace information by going to “View > Other Windows > Application Insights Search”. If we enter a date and time in the “From” and “To” inputs and click the search icon, we will hopefully see trace information for the API calls in the bottom half of the screen. The actual individual trace items are in the middle column. If we click on a trace item, we get additional details of the item to the right of it. The element that I find really useful in the “Track Operation” section on the bottom right of the screen. This gives us an overview of the API call and we can quickly see what bits are slow and need further investigation.
“Application Insights Trends” is great for giving us an overview of the trace information. We can access this in Visual Studio via View > Other Windows > Application Insights Trends.
Personally, I prefer the UX of Prefix, but Application Insights is worth a look.
SQL Server Profiler
As the name suggests, SQL Server Profiler traces the SQL statements executed on a SQL Server database. This is a tool that comes with SQL Server and obviously is only useful if our API uses SQL Server for its storage! If we are using a different database then there is likely to be an equivalent profiler.
We can use this tool if our higher level profiling tool (like Prefix or an APM) has pointed to a problem in the data access code. This gives us a clear understanding of what SQL is being executed along with the associated costs.
This tool can also give us all the activity from the SQL Server - it may not be our API that is problematic - it may be some other process that is hogging the resources.
As well as the duration of each SQL statement, we can get other useful performance related information like the amount of CPU in milliseconds used by the statement, the number of page read I/Os caused by the statement and the number of page write I/Os caused by the statement.

Visual Studio Memory Profiler
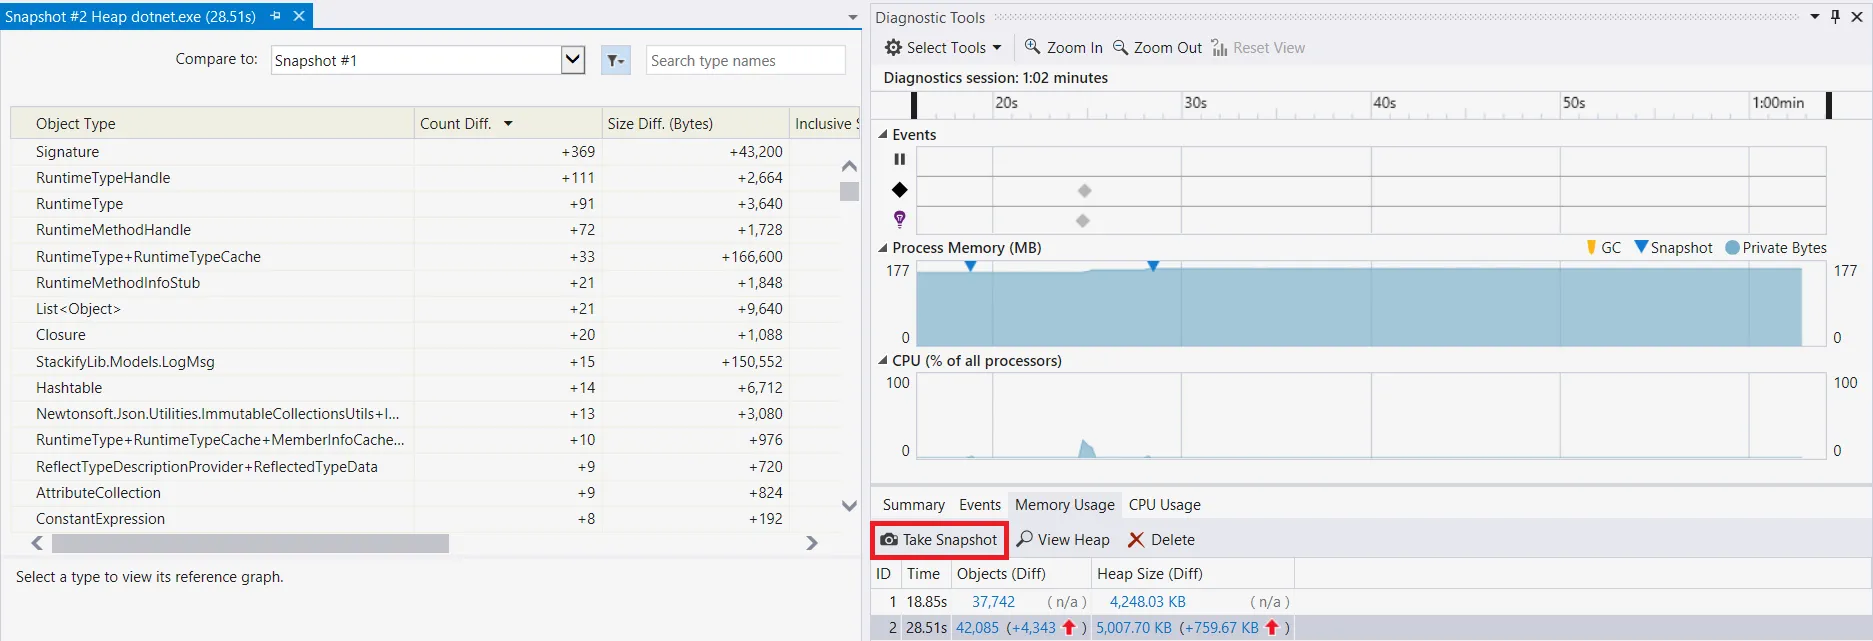
Visual Studio has a set of low level profiling tools. The one that I find most useful is the memory profiler which lets us take snapshots of the managed and native memory heap and drill in to the differences between the snapshots. This can help us find memory leaks or just inefficient use of memory in our code.
We can switch the memory profiler on by clicking “Debug / Windows / Show Diagnostic Tools”.
We won’t be using this every day - just when our higher level profiling tool points to a problem in a specific area of code that we want to profile a little deeper.
Application Performance Monitoring (APM) Tools
APMs are primarily used to profile our code in production with regards to performance. However, these tools are also useful in the QA environment - particularly if we are running a load test and want to measure how different parts of the API perform.
Stackify Retrace
Stackify Retrace is a service that allows us to track the same as Stackify Prefix tracks, but it tracks it in production. It also tracks other metrics on the server such as CPU usage. Retrace can also notify us when certain events happen - e.g. when CPU usage > 90%.
In addition to adding the same middleware to our API code as we did for Prefix, we need to register with Stackify and download and install an agent. The agent will send the profile information to Stackify for us to view in their portal.
As with most APMs, this is a paid service which starts from $10 per month at the moment.
Application Insights
As mentioned before, Application Insights is Microsoft’s fully fledged APM tool. As well as wiring up locally, we can wire this up to the Azure Application Insights service. This allows us to view the information in the Azure Portal.
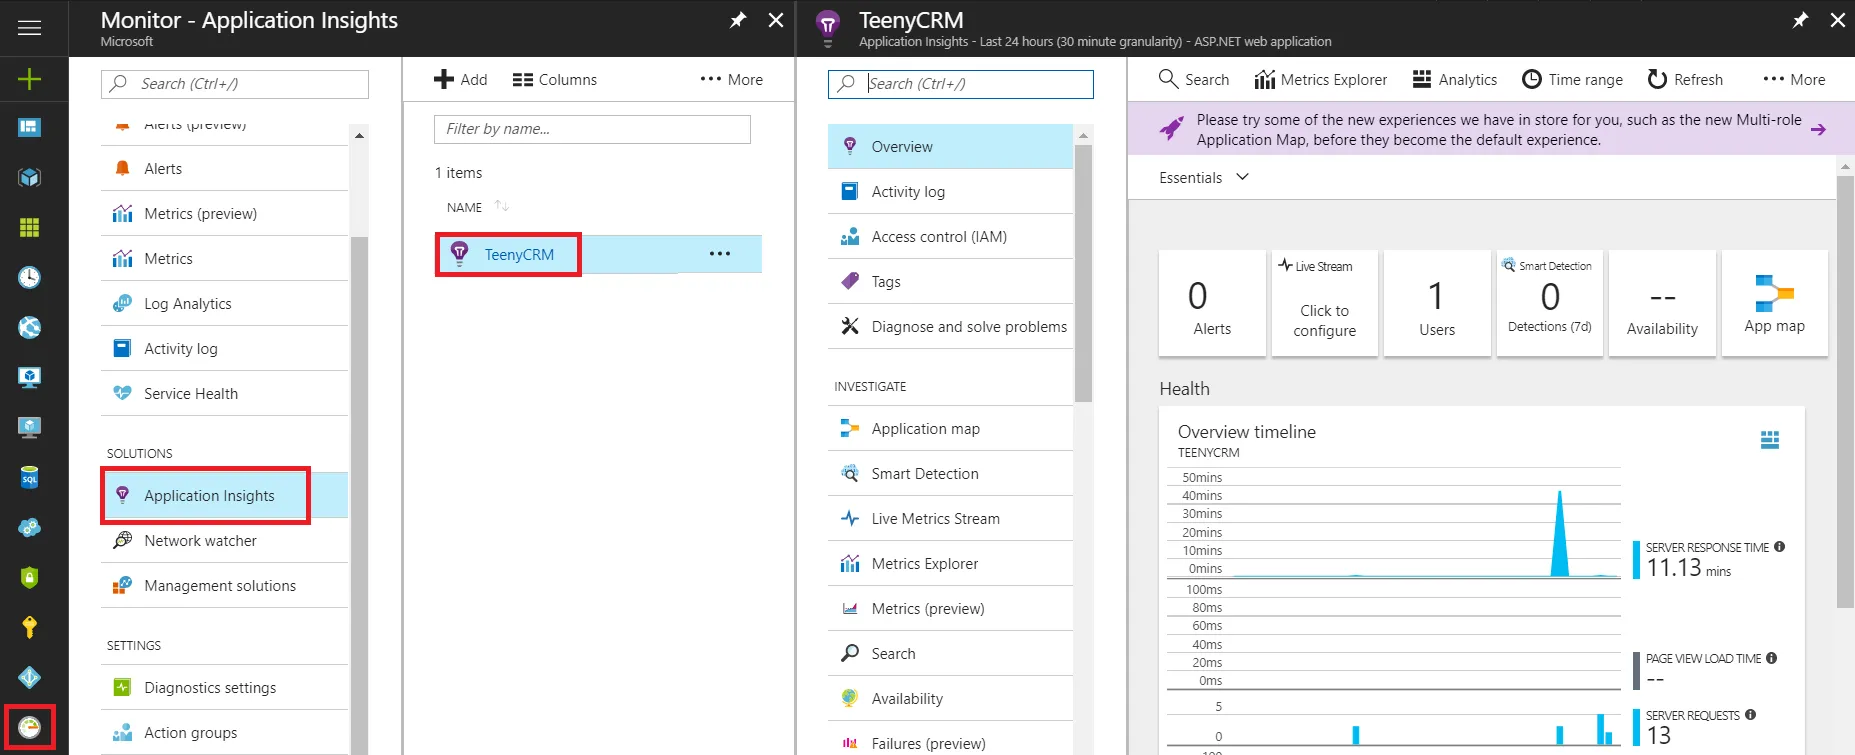
The nice thing about this APM is that there is a free usage tier for up to 1GB worth of data. Worth a look - particularly if our API is hosted in Azure.
So, there we have a range of high level and low level profiling tools that work well with ASP.NET Core 2.0. In the next post we’ll look at load testing tools …
Comments
Maxim Markelow March 10, 2018
Thanks for article. Did you use AppMetrics https://github.com/AppMetrics/AppMetrics or Prometheus with Grafana https://prometheus.io/docs/visualization/grafana/?