Chrome DevTools Console Tips
Back in January, I posted a bunch of productivity tips for when using Chrome DevTools. In this post I go through more tips on the DevTools console …
Logging
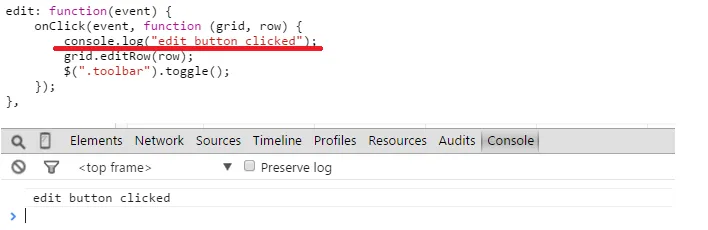
I find it really useful to log useful information about the state of the app at given points, out to the console. You can do this using console.log():
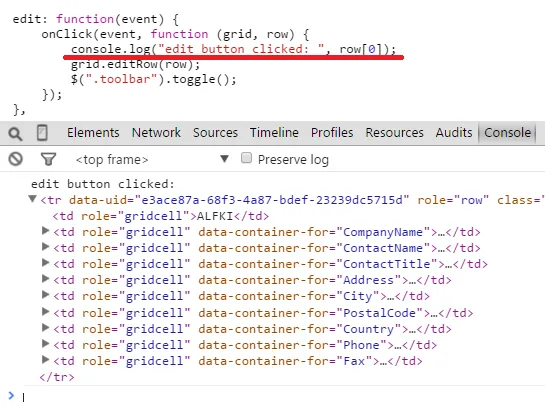
You can also include the state of objects:
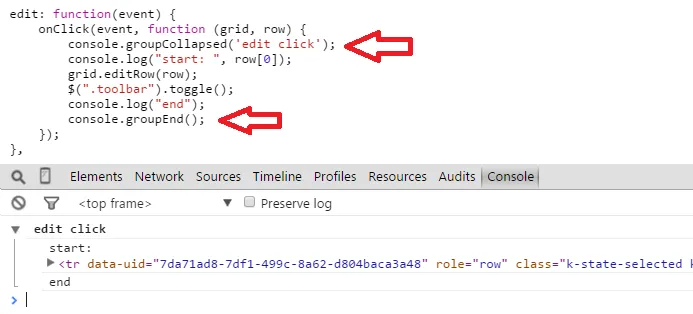
You can also group logs together using console.groupCollapsed() and console.end():
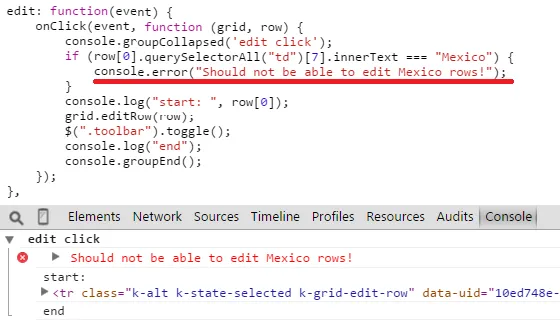
You can highlight errors by using console.error():
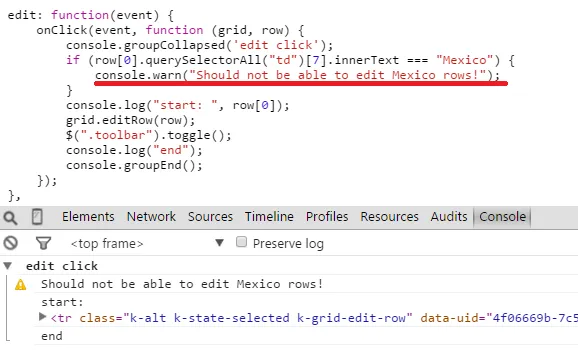
You can also highlight warnings by using console.warn():
Timing
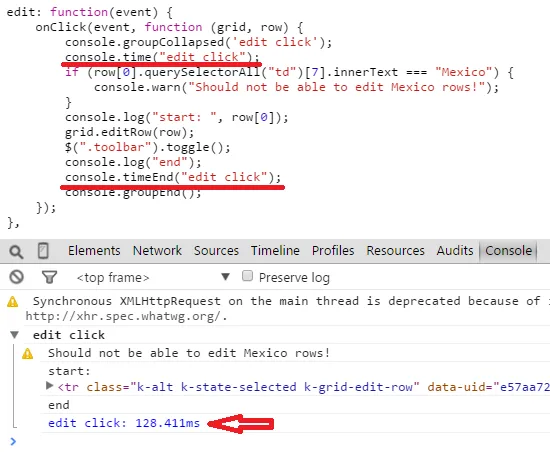
When working on performance, I often need to time the execution of sections of code - the console API gives us a nice way to do this:
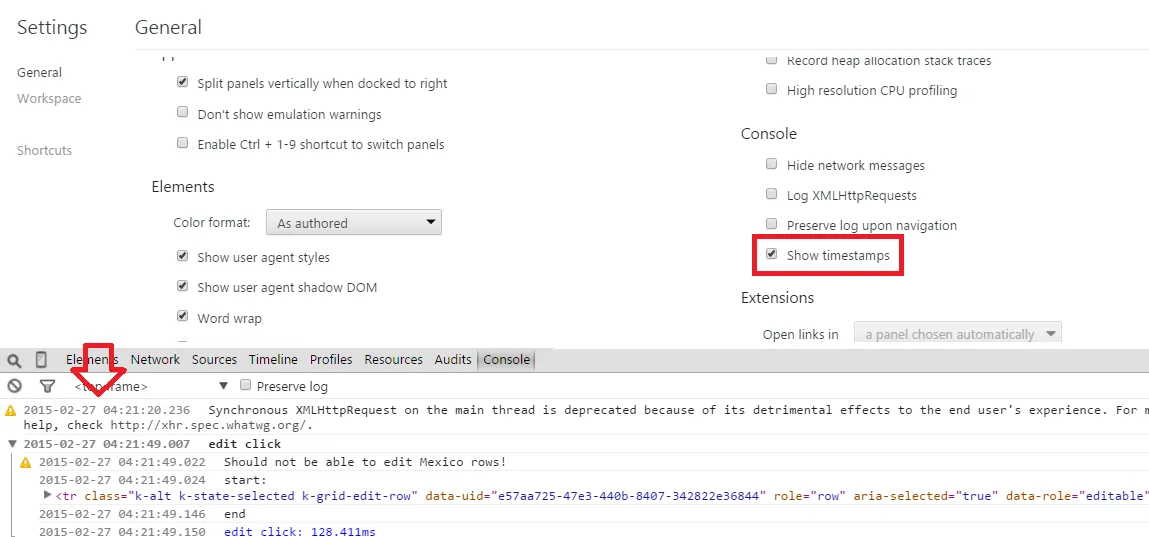
There is also a setting that allows you to show a timestamp on each log:
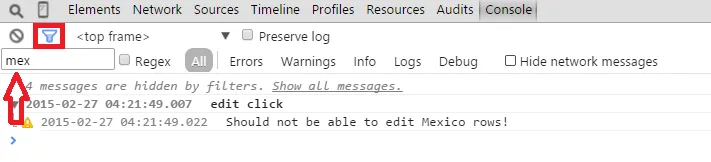
Filtering
When you start logging lots of stuff, the console can get busy. So, there’s a nifty filter bar that you can use to find the logs you are looking for:
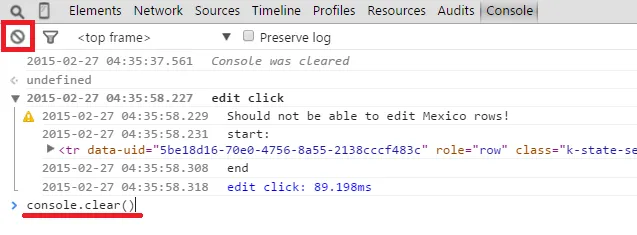
Clearing
When the console gets busy and you are about to start a new debugging process, it’s nice to clear out all the logs. You can do this using console.clear() or using the clear button: