3 ways to debug node apps
node-inspector + Chrome
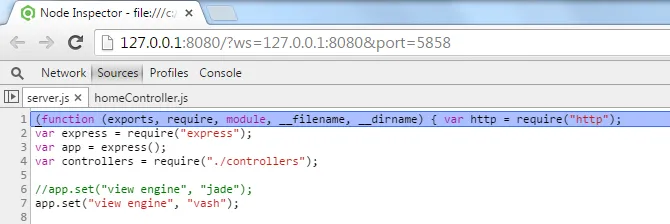
Here’s how you can use node-inspector, a node debugger, along with Chrome DevTools to debug a node app …
First install node-inspector globally by typing the following in a command line:
npm install -g node-inspectorNow run the node app in debug mode:
node-debug server.jsChrome then loads, opens DevTools and breaks on the first line of your JavaScript. You can then step through your code, add breakpoints, watch variables, … as you would if you were debugging clientside JavaScript. You can debug any request to the node application from any browser.
Visual Studio Code
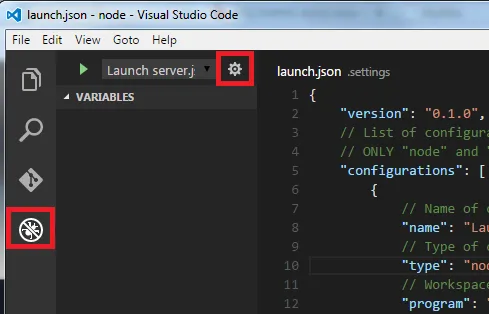
Here’s how to debug a node app using Visual Studio Code …
First click the debug icon in the left panel and then click the configure icon.
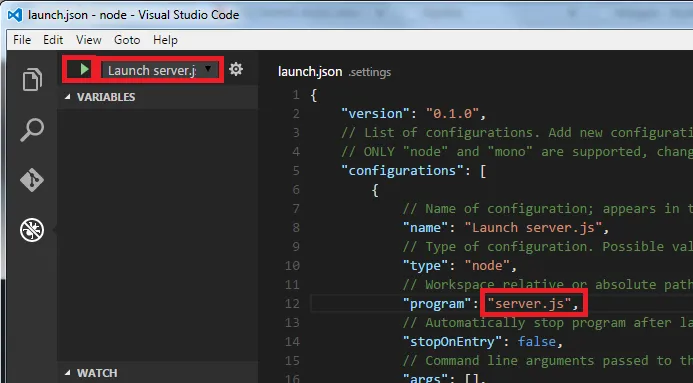
Change the program attribute within launch.json to the correct name of your root node file. Select the root node file in the drop down to the right of the play button. Put a break point in the node code by clicking in the left margin. Click the play icon and the node app will start and break on the break point.
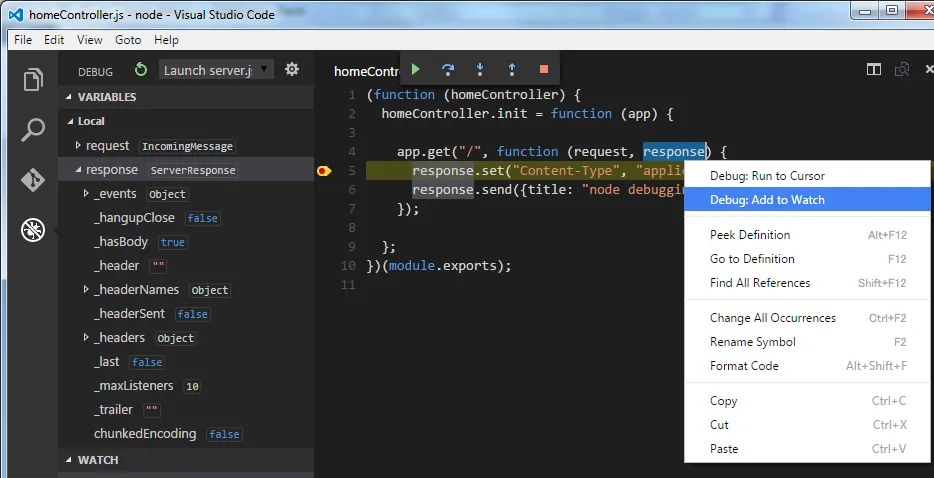
When you request a resource from the node app, it will break at the line of code where the break point is. You can add watches, see the call stack, … do all the usual stuff in a debugging session.
Web Storm
Here’s how to debug a node app using Web Storm …
First, make sure the node plugin is enabled by going to File > Settings … > Plugins. NodeJS should be listed an ticked. Now make sure the configuration for node is correct in Run > Edit Configurations 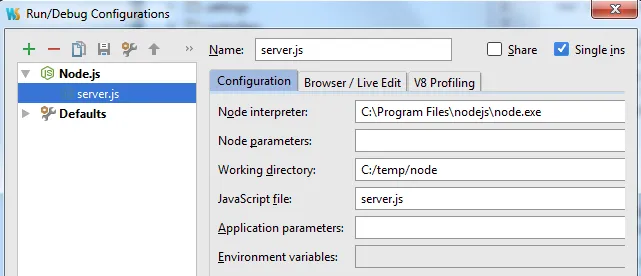
Put a break point in the node code by clicking in the left margin. To debug the node app, click the green bug icon. 
When you request a resource from the node app, it will break at the line of code where the break point is. You can add watches, see the call stack, … do all the usual stuff in a debugging session.