Productivity Tips in Chrome DevTools
Here are a few things that have helped my dev workflow in the last few years in Chrome DevTools …
UI Inspection
When debugging UI, I have found Inspect element a great way to drill straight into complicated UIs.
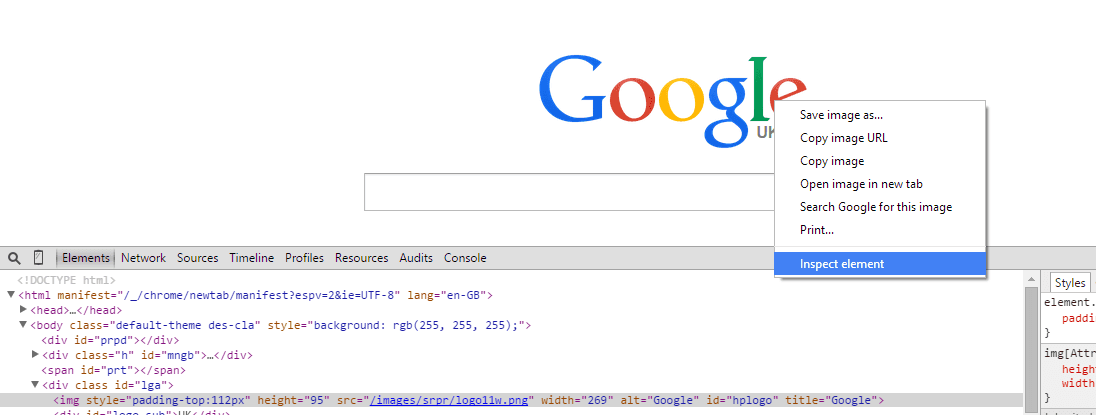
Right click where you want to drill in on the page, and choose Inspect element and the relevant node in the mark up will be highlighted.
UI fiddling
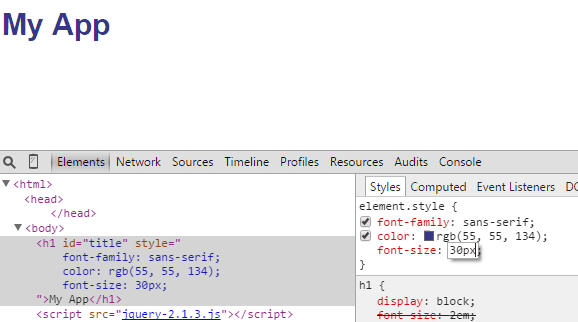
When creating new UI, I find it really useful to fiddle with the UI in the elements panel. I drill into the UI element using Inspect element and add attributes to element.style in the style section. This is great for fiddling with font sizing, margins and colours.
Navigating JavaScript
When navigating through JavaScript code, I find remembering a couple of shortcut keys speeds this process up for me.
Ctrl P allows you to navigate through different files. After typing Ctrl P, a list of files will appear. Start typing the name of the file you want to open and the list will reduce. Use the down arrow key to move to the required file in the list and hit the return key to open the file.
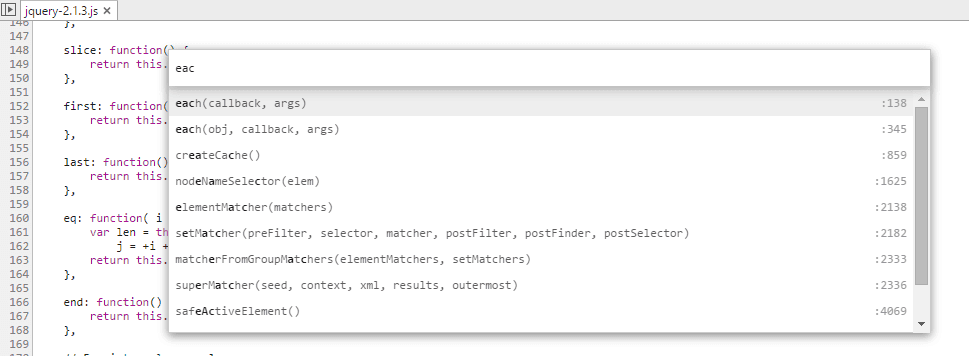
Shift Ctrl P will allow you to navigate through functions within a file. Again after typing Shift Ctrl P, a list of functions will appear. Start typing the name of the function you want to go to and the list will reduce. Use the down arrow key to move to the required function in the list and hit the return key to go to the function.
Stepping through JavaScript
When debugging your JavaScript, F11 will step through the lines of code. I find it really useful to be able to step over certain functions like calls to 3rd party libraries - F10 allows you to do that.
Conditional Breakpoints
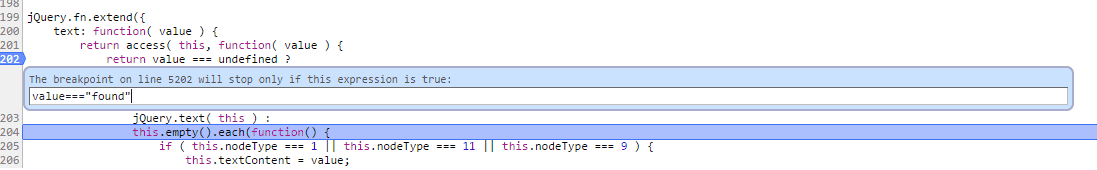
You add a breakpoint in your JavaScript by clicking on the left margin on the line number. When debugging code that gets called many times (e.g. code in a loop), I find that I can get to the point I want to debug quicker by turning the breakpoint into a conditional breakpoint. To do this, right click on the breakpoint and select Edit breakpoint …. You then need to specify a JavaScript expression that evaluates to true when you want your breakpoint to activate.
Make it bigger
I find it hard to read the JavaScript, HTML, … in DevTools - it’s too small (I must be getting old!). Ctrl + will make all the text in DevTools bigger.
Edit your source
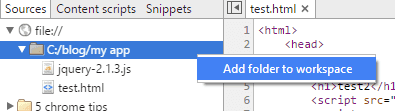
Whilst debugging HTML, JavaScript and CSS in DevTools, being able to make changes and continue debugging without having to go back to my code editor, speeds up my workflow. Before you can do this, you will need to associate your web app’s folder with a workspace in DevTools. To do this, right click in the left panel of the sources panel and select Add folder to workspace.
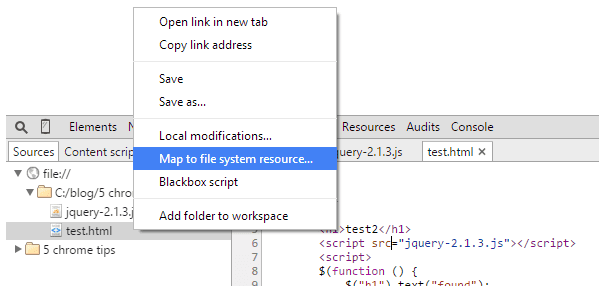
Before you can make and save changes to files in DevTools, you need to carry out one more step … In the sources panel, right click on the file you want to change and select Map to file system resource… and then select the folder in the list that appears. Luckily, DevTools remembers the workspace and file mappings when you next open your web app in DevTools.

You can then make the changes to your code directly in the source panel and hit Ctrl S to save the changes in the actual source file.
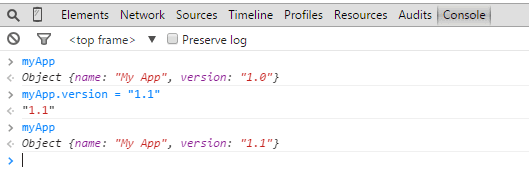
Use the console to inspect and test
Using the console to inspect the state of variables has helped me a lot in my debugging process. Just type a variable and you get details of the whole object graph for that variable. You can even change the state of the variables in here as well during your debugging process.